But to get a firm picture of what is happening to cash you need to reverse out non cash entries.
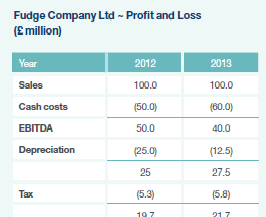
Here’s an example of a company’s profit and loss statement:

It looks as if Fudge Company Ltd is doing well; profit in 2013 of £21.7m was up on profit of £19.7m in 2012. However, a closer inspection of the statement shows that this might well be just because the directors changed the depreciation policy.
Depreciation is the accountants’ way of moving the purchase cost of a machine into the profit and loss statement over time. Usually it is something like 10% of the cost of the machine every year for ten years.
If the directors of Fudge Company Ltd saw cash costs go up from £50m to £60m they could change the depreciation policy to write their machines off over twenty years, rather than just ten. This would halve the depreciation charge from £25m to £12.5m and result in a higher profit in the Report and Accounts. In fact, Fudge Company Ltd is doing less well as it only made £40m of pre-tax cash profit, or EBITDA, rather than £50m in the year 2012.
EBITDA stands for Earnings Before Interest Tax Depreciation and Amortisation and means cash profit before tax.