Historic context is useful in understanding the energy sector. Growth in demand for energy has been a key feature of economic progress for 250 years. For reasons of space, size of investable universe, and the interest in the outlook for the oil price caused by the recent slump, this commentary focuses on oil.
Growth in demand
For 100 years oil has been the key transport fuel because its energy density is unequalled by any other transport fuel. After a spurt in the 1950–70 period, as the developed world adopted the motor car, over the last 19 years global oil demand has grown steadily at between 1% and 2% pa behind GDP growth. Thus, from 1995 to 2014 oil demand has grown from 70.3 million barrels per day (b/d) to 92 million b/d or 31% (1.4%pa) while real global GDP has grown from $44.9tn to $77.5tn, or 68.4% (2.8%pa).
Over this period oil has mostly been displaced from electricity generation and heating by cheaper alternatives. But its place as the transport fuel du jour has not been seriously challenged.
We see no reason for this picture to change much over the next 30 years as the 6 billion non-OECD population see their standard of living catch up with those of 1.25bn OECD inhabitants. We estimate for example that the world vehicle fleet is expanding from 1bn vehicles in 2010 to 2bn in 2030. No considered projections of electric or gas powered vehicles make a significant dent in this picture. And we forecast oil demand in 2035 to be 115 million b/d.
As a generalisation, cheap sources of oil are being used up and more expensive sources are steadily becoming economic as we master deep water drilling, extracting oil from tar sands or fracking.
Growth in Supply
Self evidently growth in supply has had to match this. The highlights of the history of the last fifty years have been:
|
1950–70 |
Development of Middle East |
|
1970–90 |
Development of Gulf of Mexico; Alaska; North Sea; decline in Russia and parts of Middle East |
|
1990–2010 |
Development of West Africa; China; Caspian; recovery in Russia |
|
2000–2015 |
Development of oil sands; Brazil; onshore US Shale oil; and most recently, ramp up by Saudi/Kuwait/ UAE and Iraq but decline in North Sea; Mexico; collapse in Libya and depressed production in Iran (due to sanctions) |
The oil price
The history of the oil price over its whole life has been dominated by two key factors – small imbalances of supply and demand which can cause disproportionately large price fluctuations (because short run price elasticity of demand and supply is very low). But the second key factor is that these can be dampened by the behaviour of one or more large market participants if and when they decide to play a price management role – Standard Oil, the Texas Railroad Commission and the “Seven Sisters” have all from time to time played this role – and, most recently from 1999–2014, so has OPEC.
THE PRESENT CONUNDRUM
Today we have a classic imbalance scenario. The rapid development of shale oil in the US during 2010–14 and the decision by Saudi Arabia, UAE and Kuwait (‘SUK’) to seek to damp this down by ceasing to support the oil price by cutting their production, has created an over-supply that is driving the price down. And energy equities are very unloved (institutional under-ownership at the extreme) and on some metrics at extreme cheapness levels. So what do we think? We are confident the next two years will see US production growth go into reverse. Indeed on a month on month basis and, following the recent collapse in the US onshore horizontal rig count over the last 8 months from 1,275 (2014 average) to 676, monthly US production data has stopped growing:

And the lower oil price is stimulating an above average 1.6m b/d global demand growth. However, SUK’s ramp up in production, Iraq’s recent strength, and prospective recovery in Libya and Iran mean that the maths of the global imbalance are, that it may not start to reverse until end 2016 (i.e. it is not until then that demand will exceed supply and there will still be a big stock overhang to work off).
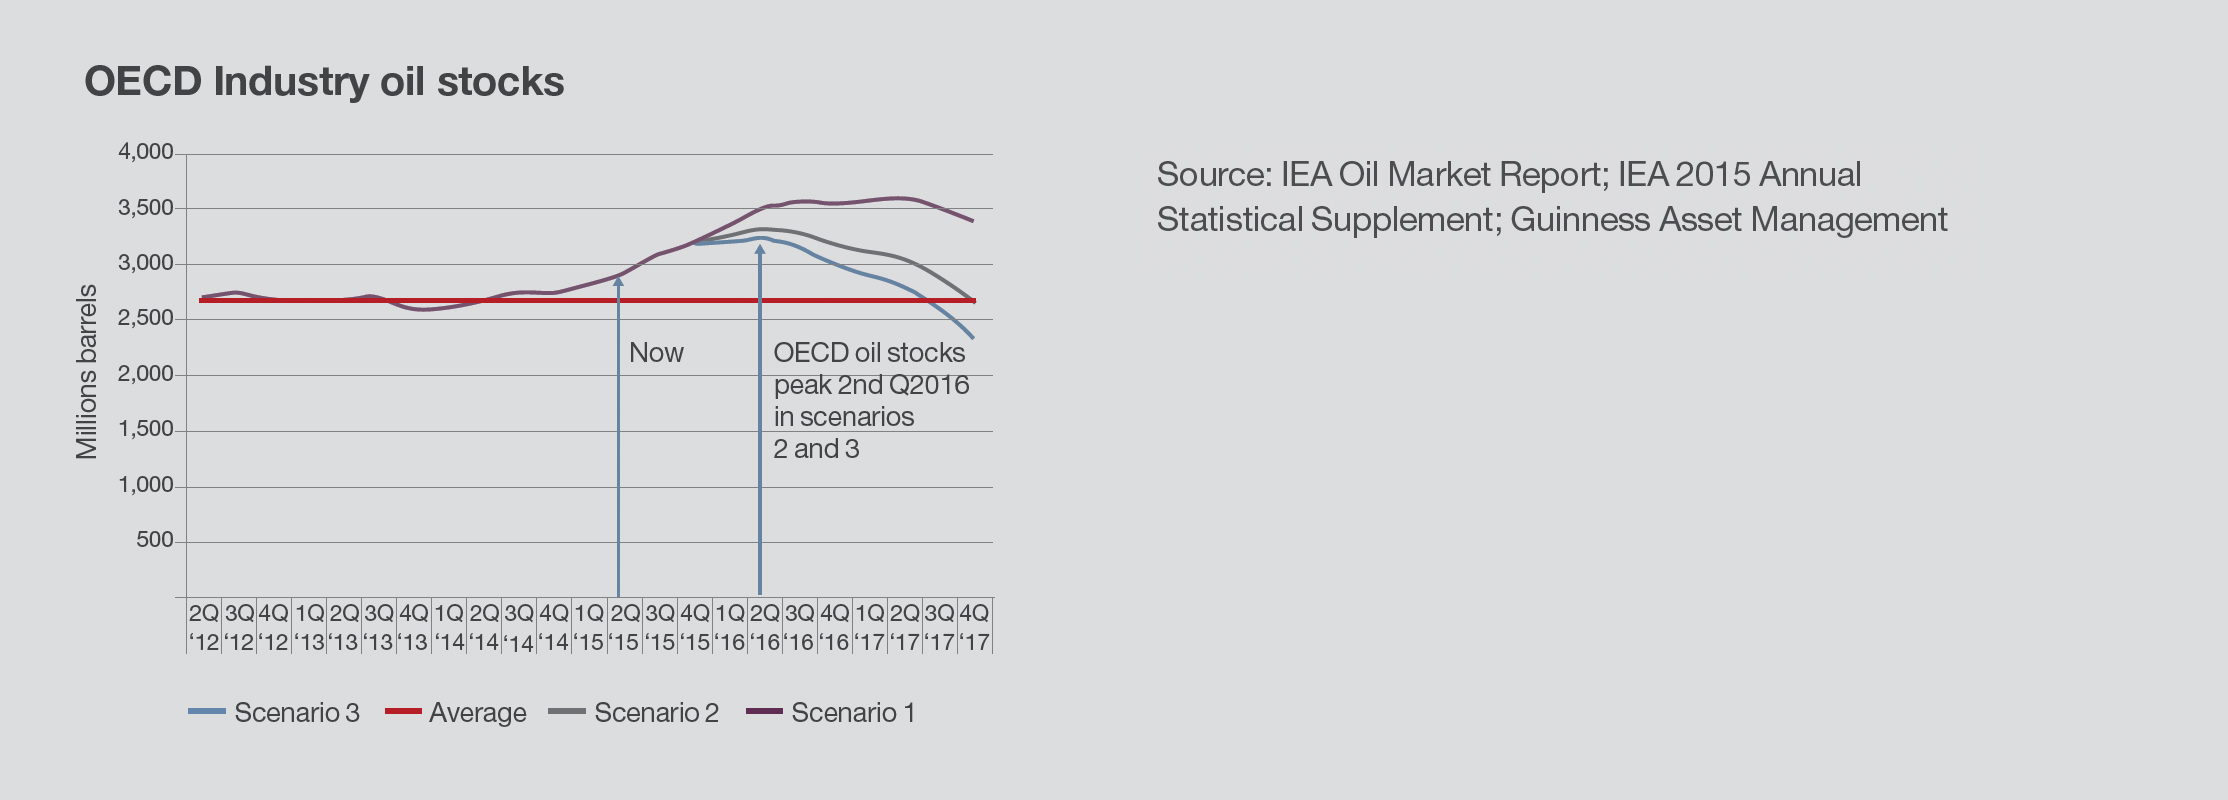
On this analysis it is 1 am! However, there is an important element this analysis overlooks: Saudi behaviour. We believe there is a strong likelihood that when Saudi’s objective is achieved – say evidenced by nine months of successive US production decline (perhaps next March) – they will start to manage supply again – not to get the price up to $100 but more likely $80. To illustrate this we model three scenarios. All conservatively assume Iran and Libya fully recover to 3.9m b/d and 1.6m b/d respectively and Iraq stabilises at 4.2m b/d but assume (1) SUK produce at 2003–10 average, 1m b/d less and 1.5m b/d less. The graph is OECD inventories vs. 2nd quarter 2012–2nd quarter 2014 average:

Scenario 1 is the 1am case but on the basis of scenarios 2 and 3, oil stocks will peak 10 months from now and return to normal levels by mid 2017. Therefore, maybe it is more like it is 4am and, given equity markets typically are anticipatory by 6–9 months, it may even be 5am – the very darkest before the dawn moment!


